# Google Trends Market Sentiment Analysis Tool
## Overview
Traditional market data captures what has happened, but rarely explains *why* or what happens next. This project introduces a systematic framework that leverages alternative data—specifically online search volumes via Google Trends—as a leading indicator for tactical asset allocation and risk control.
By analyzing real-time shifts in collective investor attention, the tool quantifies market psychology before it fully materializes into trading decisions.
---
## The Core Scaling Challenge & Solution
> **The Problem:** Google Trends normalizes search volume to a relative $0 \text{ to } 100$ scale *per individual request*. This makes it statistically impossible to directly compare or chain together data from different batch requests.
>
> **The Algorithmic Solution:** This script implements an **"Anchor-Logic"** to establish a unified global scale. Every automated batch request includes a high-volume, neutral reference term (configurable via `--anchor`, default: `'weather'`). The pipeline then dynamically rescales parallel batches using the **median ratio** of the overlapping anchor series:
>
> $$\text{Scaling Factor} = \text{median}\left(\frac{\text{Anchor}_{\text{Target Batch}}}{\text{Anchor}_{\text{Reference Batch}}}\right)$$
>
> This technique achieves true cross-batch comparability across independent API calls.
---
## Methodology & Pipeline Architecture
The prototype (`google_trends_sentiment_prototype.py`) is structured as a modular quantitative pipeline:
### 1. Data Ingestion (Anchor-Based)
Automated retrieval of pre-defined Risk-On, Risk-Off, and Macroeconomic keywords via the `pytrends` API, structurally unified globally using the Anchor-Logic described above.
### 2. Normalization Layer
Applies a **Z-score transformation** to the rescaled raw data. This establishes statistical parity across keywords with vastly different structural search volumes by centering the mean at $0$ and scaling variance to $1$:
$$z = \frac{x - \mu}{\sigma}$$
Where:
* $x$ is the anchor-adjusted search volume intensity.
* $\mu$ is the historical mean of that specific keyword series.
* $\sigma$ is the historical standard deviation of the series.
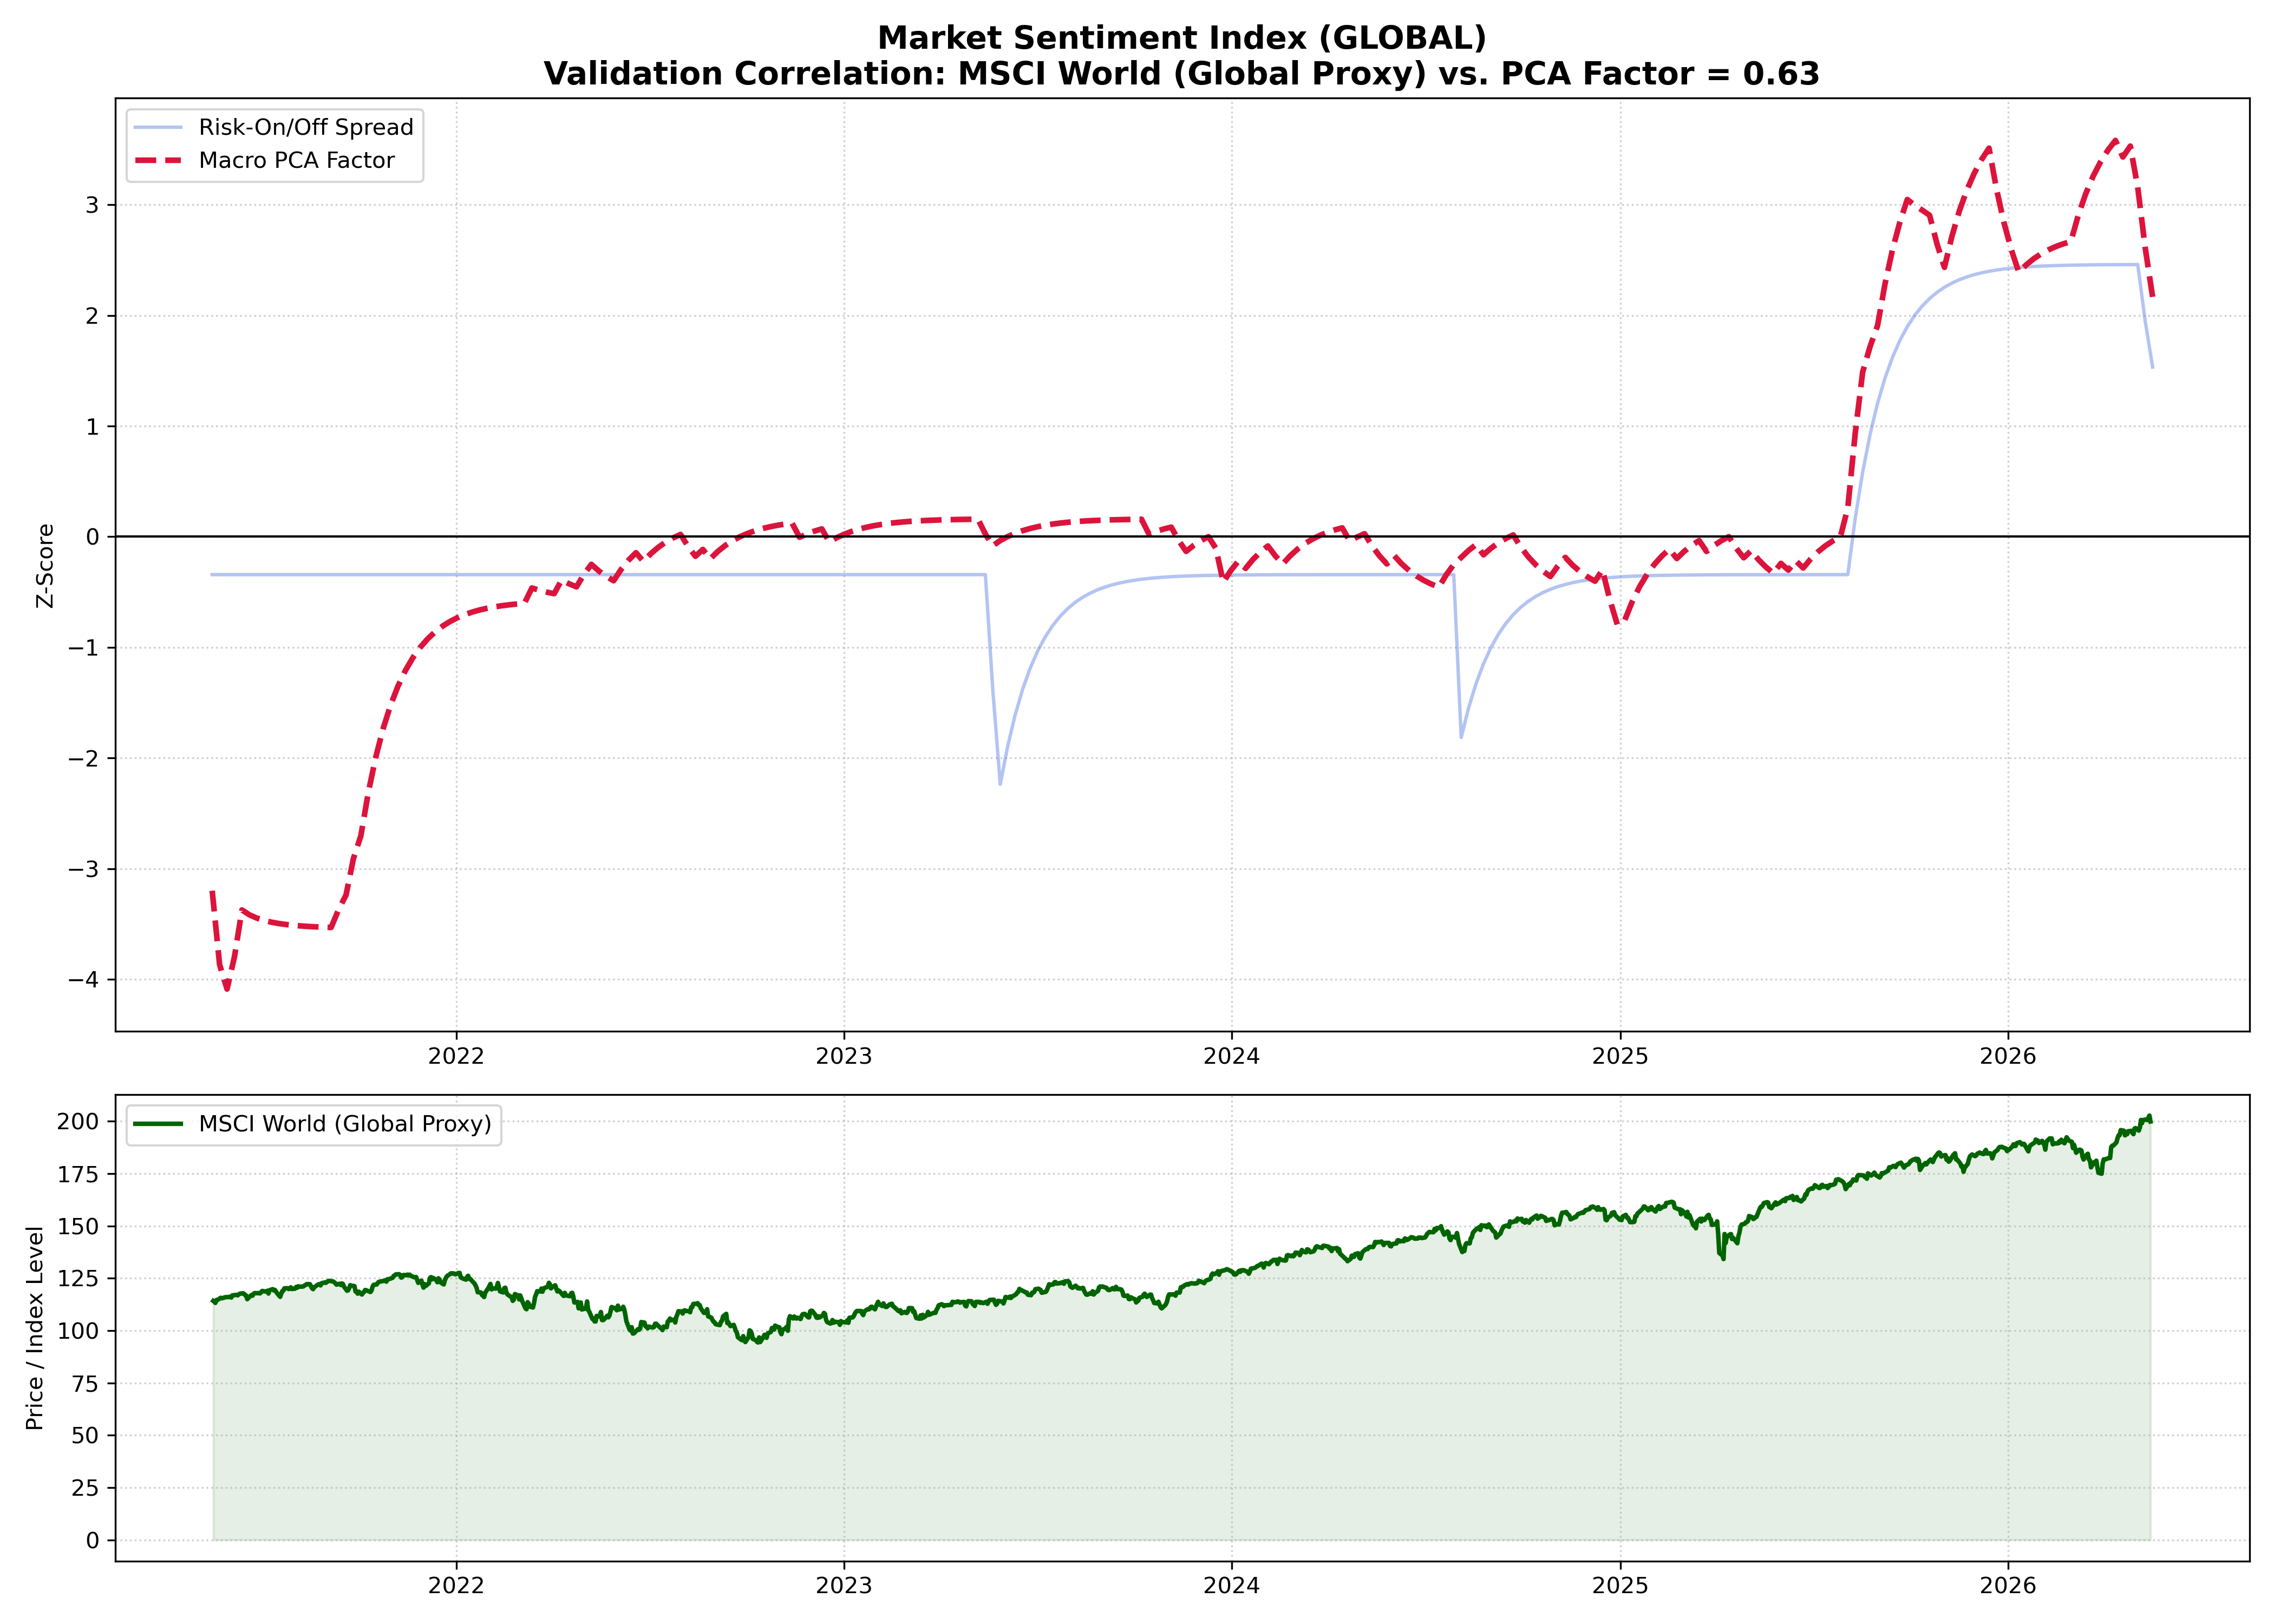
### 3. Index Construction & Signal Extraction
* **Sentiment Spread:** Measures the relative strength of optimism versus pessimism in the market:
$$\text{Sentiment Spread} = \left( \frac{1}{N} \sum_{i=1}^{N} z_{\text{Risk-On}, i} \right) - \left( \frac{1}{M} \sum_{j=1}^{M} z_{\text{Risk-Off}, j} \right)$$
* **Macro PCA Factor:** Extracts the first principal component ($PC_1$) from the combined Z-score feature matrix using Singular Value Decomposition (SVD) via `scikit-learn`:
$$\mathbf{Z} = \mathbf{U}\mathbf{\Sigma}\mathbf{V}^T \implies PC_1 = \mathbf{Z}\mathbf{v}_1$$
This isolates the dominant underlying psychological driver capturing the highest common variance.
### 4. Market Validation (Optional)
Resamples the extracted signals to a weekly frequency and performs quantitative correlation analysis against live financial benchmarks using `yfinance` without compromising the statistical independence of the core signal.
*Note: This prototype currently focuses on contemporaneous correlation as a proof-of-concept. Time horizons and keyword definitions are structurally predefined rather than data-driven optimized.*
---
## Getting Started
### Dependencies
Install the required quantitative stack:
```bash
pip install pytrends pandas numpy scikit-learn yfinance matplotlib
```
### Command Line Interface (CLI) Usage
The script features a fully parameterized CLI. You can customize the geographic scope, validation benchmark, time horizons, Google properties, and the anchor term itself.
```bash
# Display the full help menu and options
python google_trends_sentiment_prototype.py -h
```
### Advanced CLI Examples:
```bash
# 1. Standard global run validating against the MSCI World ETF (URTH)
python google_trends_sentiment_prototype.py --geo GLOBAL --ticker URTH
# 2. Localized analysis for Germany validating against the DAX over a specific 5-year period
python google_trends_sentiment_prototype.py --geo DE --ticker ^GDAXI --timeframe "today 5-y"
# 3. Target Google News specifically rather than general web search, disabling visual plots
python google_trends_sentiment_prototype.py --gprop news --no-plot
# 4. Change the anchor term to a custom high-volume baseline
python google_trends_sentiment_prototype.py --anchor "news" --ticker URTH
```
### Full CLI Arguments Reference:
**Flag**,**Type**,**Default**,**Description**
```bash
"-h, --help",Flag,-,Show the help message and exit.
--geo GEO,String,'GLOBAL',"Geographic region code (ISO 3166-1 alpha-2). E.g., 'US', 'DE'."
--ticker TICKER,String,None,"Yahoo Finance ticker symbol for validation (e.g., '^GSPC', 'URTH')."
--timeframe TIMEFRAME,String,'today 5-y',"Data duration. Supports 'today 12-m', 'today 5-y', or specific 'YYYY-MM-DD YYYY-MM-DD'."
--gprop GPROP,String,'' (Web),"Google property filter. Supports '' (Web Search), 'news', 'images', 'froogle', or 'youtube'."
--anchor ANCHOR,String,'weather',Reference term used to rescale and link multiple keyword batches together.
--no-plot,Flag,False,Disables visual plot generation (.png) and only serializes the computed CSV data.
```
### Generated Outputs
he pipeline structures and serializes its findings into the following artifacts (where represents your chosen region code):
- `trends_raw_.csv`: The compiled, raw Google Trends search intensities.
- `trends_features_.csv`: The engineered feature set post-Z-score transformation.
- `sentiment_data_.csv`: The final calculated Sentiment Spread and Macro PCA Factor.
- `sentiment_plot_.png` / `combined_sentiment_analysis_.png`: Visual correlation plots mapping the extracted sentiment against your chosen financial benchmark.